
Part 1: International SEO Forecast: Data-Driven Predictions Based on the Home Market
What do you do as a marketing or SEO specialist when management wants to expand into Germany or France? They look to you for traffic and ROI projections for the next two years.
So what do we usually do? We open tools like Semrush or Ahrefs. We run an extensive keyword research and add up all the search volumes. Then we pull up a standard Click-Through Rate (CTR) curve. Then we grab a standard CTR curve and calculate, for example, a 6% CTR for position 3. We run the numbers, put them in Excel, and present a beautiful hockey-stick graph. Management is enthusiastic. Budget approved.
Six to twelve months later? You might hit 10% of that forecast. The budget gets frozen. And then you have to explain to the board why the results are falling far short of the forecast. You mumble that “ SEO just takes time” and that “there was yet another Google Core Update.”
A CTR forecast takes little account of the market you’re entering. Competition, SERP features, local search intent, and your own authority vary by country. That’s precisely why a forecast based solely on search volume can be quite misleading.
Disclaimer: Let’s be honest—any SEO forecast is ultimately just an estimate. No one can predict the future, and Google, ChatGPT, and other AI models aren’t entirely transparent about their algorithms either. But where the old model leaves you staring blindly at theory, this compass gives you a much better and more realistic picture of the actual results.
The foundation for your international “ SEO ” forecast: Calculate your “Capture Rate”
To make a realistic forecast, we will no longer focus on theoretical CTR curves. Instead, look first at your own home market. Your home market gives you a concrete picture of what you can achieve with your current authority and approach.
Instead of guessing, we calculate the Capture Rate. Let’s take a fictional example: a successful Dutch e-bike online store expanding into the UK.
In the Netherlands, our core set of keywords has a total search volume of 100,000 per month.
In Google Search Console , we see that we’re generating 10,000 organic clicks from that exact set.
Our proven capture rate is 10% (10,000 / 100,000).
This means you no longer need to rely on a general CTR assumption. Instead, you use your own historical performance as a starting point.
The target baseline
Now we’re applying this to the UK. We’re conducting local keyword research and see that the market there is significantly larger: a total volume of 300,000.
If we apply our Dutch Capture Rate (10%) to this, our baseline potential is 30,000 clicks per month.
Are we done now? Can we put this into Excel and head out for Friday afternoon drinks? No, definitely not. That 30,000 figure is merely the upper limit. It assumes that the UK is an exact clone of the Netherlands. And of course, it isn’t. Time to face reality. That’s why we’re adding four correction factors.
The 4 Reality-Check modifiers.
1. The Effort Modifier (E)
Your baseline assumes that you’ll invest exactly the same amount of time and budget in the UK as you have in the Netherlands over the past five years. That almost never happens. Your effort determines your ceiling:
Low Effort (0.15): We also refer to this as “Translate & Pray.” You automatically translate the site and do little to address local search intent or content. But British users search for “e-bike,” not the literally translated “electric bike.” You’re missing out on local intent and authority. The result? You’re capturing at most 15% of your potential.
Medium Effort (0.50): “Localize & Optimize.” You want to compete locally, but you don’t have the time to spend months on manual work. This, incidentally, is exactly where smart software like Clonable saves the day in terms of ROI. You can clone and translate the site lightning-fast with high quality, while retaining the ability to manually fine-tune the context, style, URLs, meta titles, and specific keywords to match local search intent. This allows you to launch a local version relatively quickly and then optimize it specifically for that audience. This approach covers about 50% of your baseline.
High Effort (1.0): The comprehensive approach. You combine scalable translation and localization via a platform such as Clonable with transcreation, a local PR agency, and targeted link building. By doing so, you assume that you can tap into the majority of the potential.
2. The Time Modifier (T)
Then comes the inevitable question from the CEO: “How soon will we see results?”
My answer? Time can’t be bought in international web SEO . Even with a massive budget, you obviously won’t hit your target in the first month.
Year 1 is the so-called Sandbox (0.25): Google must crawl thousands of new URLs and learn to trust your local entity (of course, this depends on whether you ’re using a new domain, subdomain, or subfolder , and whether it’s already known to Google and other search engines/models). Expect to achieve only about 25% of your effort-adjusted potential. Keep in mind that in the first year, you often haven’t yet reached your ultimate traffic level. Indexing, authority, and local relevance build up gradually.
3. The Competitor Density modifier (C)
Competition can vary greatly from market to market. A keyword that faces relatively little competition in the Netherlands may be much more difficult in the United Kingdom—or vice versa. Calculate the average Keyword Difficulty (KD) of your top 50 keywords in the Netherlands and compare it to the UK. Is the competition there twice as intense? Then your C-factor is 0.5. Cut your forecast in half immediately.
4. The SERP Feature modifier (S)
A search term in the Netherlands might give you 10 clean blue links. That same term in the UK is littered with a Local Pack, four Shopping carousels, and an AI Overview. The search volume may appear the same, while the share of available organic clicks is much lower. Only then should you apply an S-factor of 0.8 here: we’re deducting 20% due to a visually cluttered SERP.
The international forecast in practice
Back to our e-bike shop. What does the actual forecast look like?
Baseline: 30,000 clicks.
Effort (Medium): x 0.5 (We use Clonable for fast, scalable localization and perform manual SEO optimization). We are at 15,000.
Competition (Higher): x 0.8. We drop to 12,000.
SERP (Cluttered): x 0.8. We drop to 9,600.
Time (Year 1 sandbox): x 0.25.
Our forecast for the end of the first year is 2,400 clicks per month.
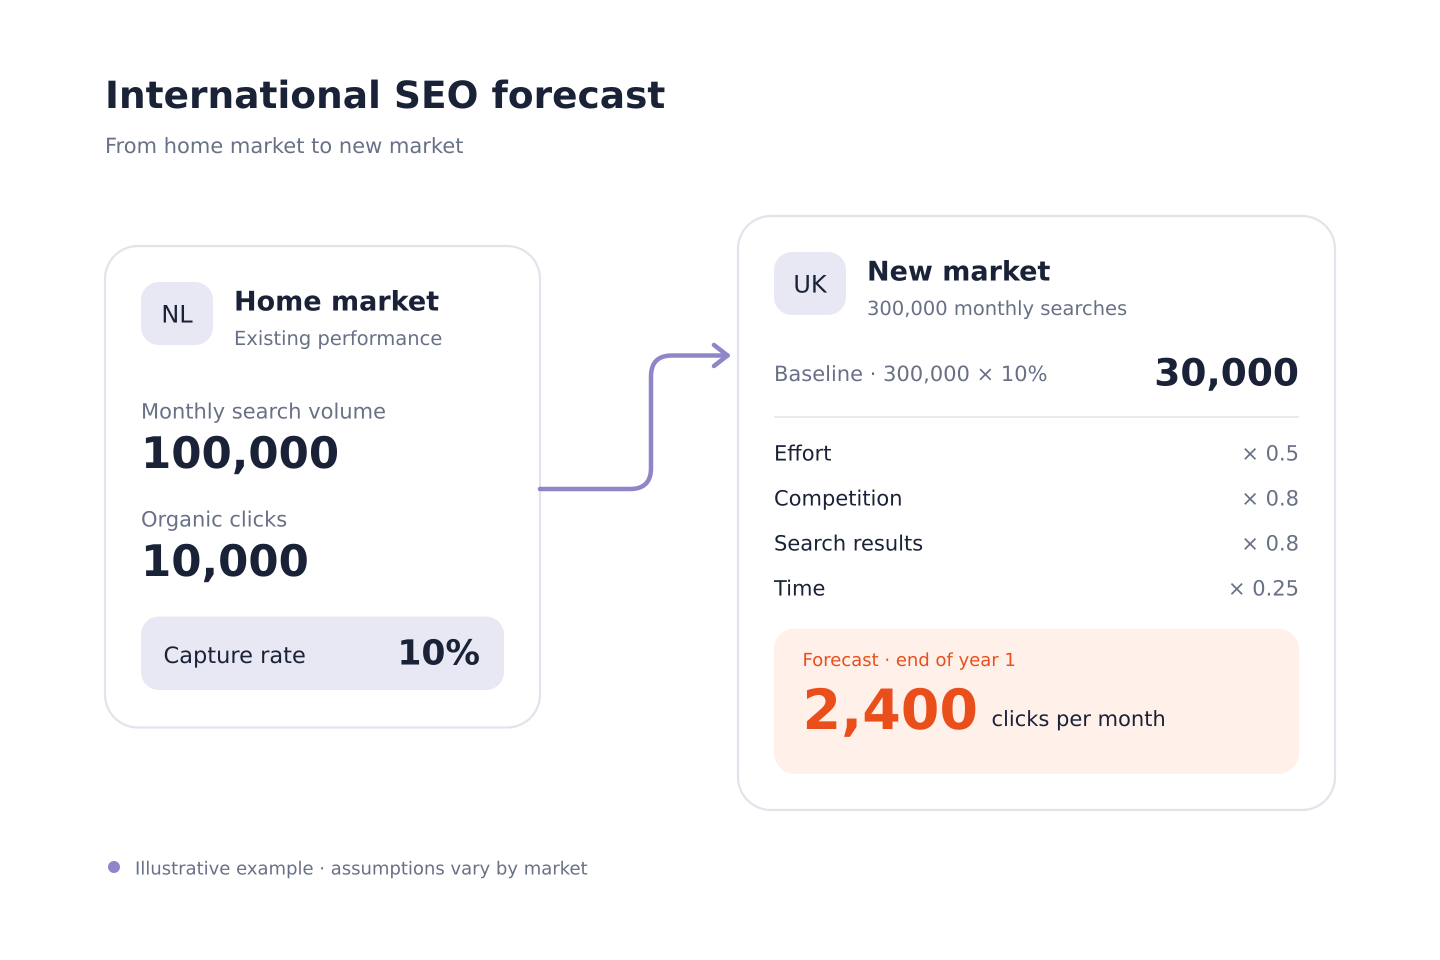
The result is less appealing but better substantiated. Moreover, you make the forecast explicitly dependent on factors that you can actually monitor.
When you present the forecast for international expansion next week, establish these three rules in the boardroom:
Our budget sets our limit. Will I get more time or staff for international SEO / localization / link building? (Translate & pray won’t lead to market dominance).
Time cannot be bought.
This forecast is a substantiated expectation, not a certainty.
In the following articles, we’ll take a closer look at three aspects of this forecast: the impact of translation and localization, the time required for international SEO , and the influence of local competition.
By: Niels Arts
Get started with Clonable for free today
Discover how to centrally manage international websites from a single platform.